Update: This post is specific to Universal Analytics, but can be applied to the new Google Analytics 4 just as easily. We have executed a few dozen GA4 implementations and can help your business get set up properly to take advantage of the capabilities of GA4.
This isn’t the only article you’ll find online to help you upload your social advertising and Bing Ads data to Google Analytics, but I do believe it’s the most comprehensive and fully automated approach. Google Analytics is very good at connecting / integrating with other Google products like Google Ads, Search Console, and Adsense. Makes sense. Google Analytics however is terrible at integrating with other ad networks. We’ve developed a solution to fix this.
Briefly here’s what we’ll cover in this post:
- What Data Import is, where your data goes, and how it’s useful.
- How to automate pulling data out of Bing, Twitter, Facebook and LinkedIn ad networks.
- How we can automate importing your ad network Impressions, Clicks, and Cost into Google Analytics for better campaign analysis.
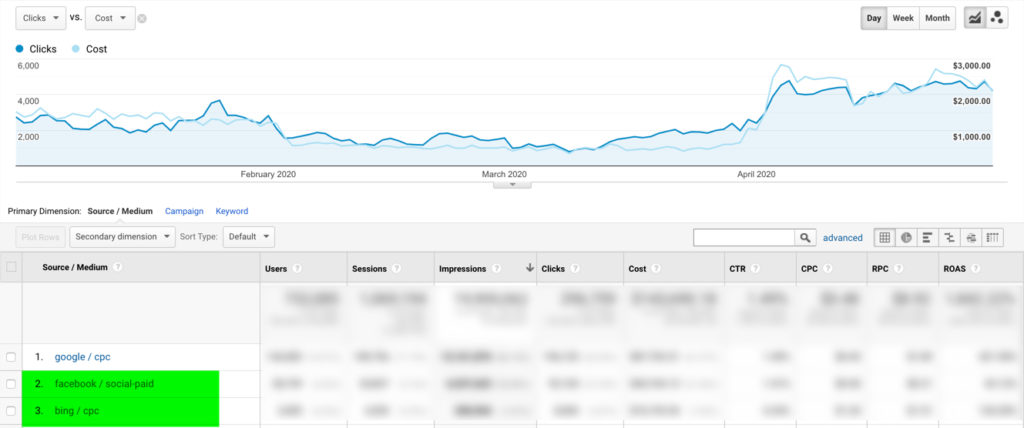
If you run ads on social networks like Facebook, Twitter or LinkedIn, as we do for many of our clients, then you’re probably reporting on the performance of those campaigns — often in comparison to Google ads — by “pulling reports” from each platform, and exporting to Excel, and then maybe some slides, and if you’re smart, then Google Data Studio dashboards. It’s. A. Lot. And while we’re big fans of Data Studio dashboards, they are just that — dashboards — they should not be used for analysis, but for reference and to help spark those “hey, why did that campaign do ‘x’? questions. Your deep analysis should be happening within Google Analytics, or exported reports.
What is Google Data Import?
Deep within the Google Analytics Admin settings is the option to import data (duh) that allows you to extend your reporting capabilities in the interface — again, eliminating extra systems and spreadsheets. This feature allows you to upload information like offline sales (point of sale) or even refunds, some non-PII user data and more. Go read the full capabilities here.
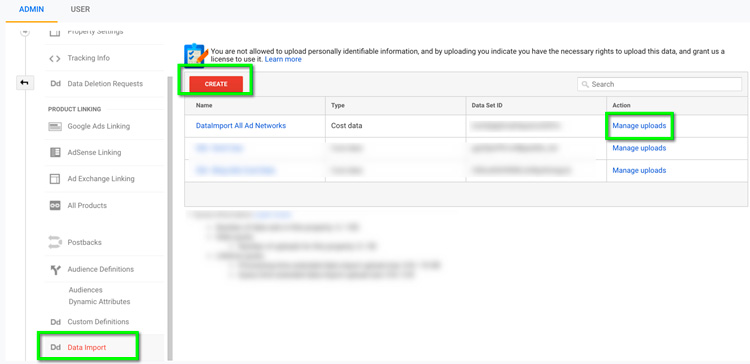
Ok cool, but now what do you get from this Data Import? Your ad network data like Impressions, Clicks and Cost is pulled into the Google Analytics Cost Analysis report and is also available in custom reports, and for passing to Google Data Studio. For ecommerce sites, this is absolutely crucial to report on RPC and ROAS (definitions below), but can also be used by lead generation sites to show how your impressions, clicks and cost align with site goals like everyone’s favorite Request a Demo. Yes, tracking clicks from social (and Bing) ad networks in GA is achieved with UTM parameters, but now all your ads data is in one interface.
Revenue Per Click (RPC)
Revenue-per-click is the average revenue (from ecommerce sales and/or goal value) you received for each click on one of your search ads.
Return On Ad Spend (ROAS)
ROAS (return on advertising spend) is calculated by dividing the conversion value (based on e-commerce revenue and/or goal value) by the ad spend.
Cost Analysis Report; Where to Find Your Data
Go to the Acquisitions Tab in the left hand navigation, and find the Campaigns section and Cost Analysis report.
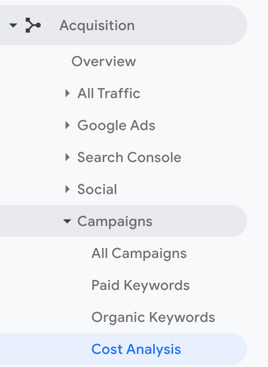
Here you’ll find all your marketing source and mediums with glorious Impressions, Clicks, and ad Cost data as well as the Transactions and Revenue they generated.
Which ad network performs better? It’s all in one place with RPC and ROAS!

Yes, and Bing too — everyone forgets about Bing.
How To Automate Social Ad Network Data Pulls
You need to pull your social ad (damn, and Bing) data into a Google Spreadsheet in order to upload it to Google Analytics. Technically, if you’re uploading to GA manually then you need a .CSV file, but the entire point of this process is to eliminate manual efforts.
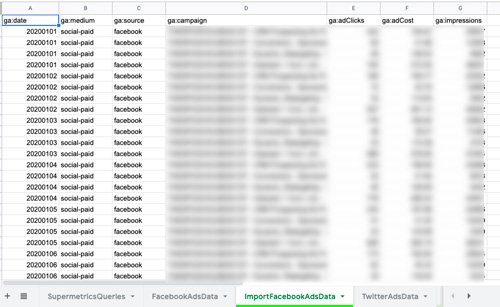
To automate your data pulls into the Google Sheet we like to use Supermetrics, which is a paid tool that can integrate with Google Sheets, and run the pulls on an automated schedule like “everyday at 3am”. When we set up the automation, the biggest thing to get right is pulling the right data into your sheet, organized by date. From there, we manipulate the data in an adjacent tab, which is formatted int he way Google Analytics needs to receive your data. One data pull and one clean tab for each network.
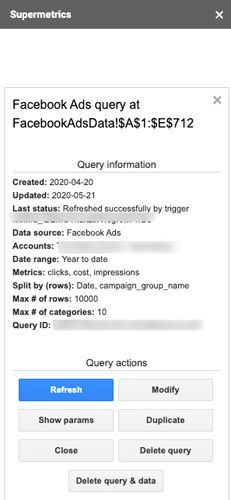
Structuring Your Data Pull
As you can see in the screens above and below, there are specific headers that correspond with Google Analytics metrics. The date needs a header of “ga:date”, and needs to be formatted as YYYYMMDD, with no other characters. The impression data needs to be in a “ga:impressions” column, and so on.
We also pay attention to edit our Source / Medium to match exactly what the client is using in their UTM tracking parameters on landing pages. In this example, we’re pulling “facebook / social-paid” to match their session data already in GA reports.
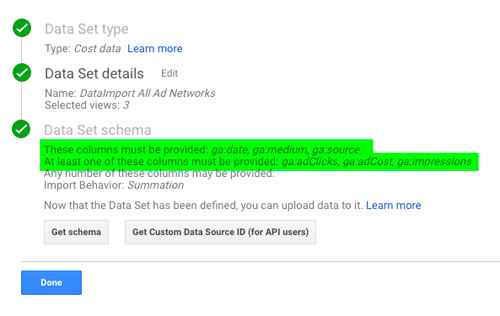
Import Social Ad Data to Google Analytics
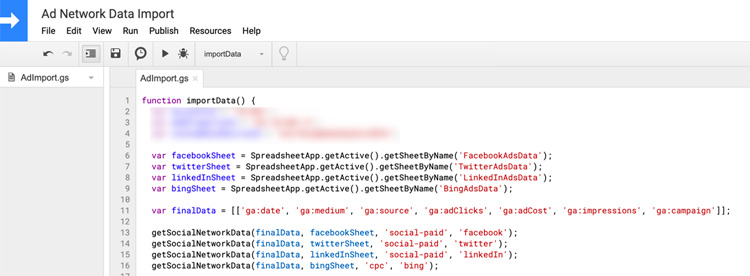
Now here’s where things get fancy. Using Google Apps Scripts our developer was able to write a program that checks for updates to the data pulls and then through an API connection to Google Analytics and then uploads them directly into the Cost Data Import we set up. We’ve set up triggers to run this process every morning about an hour after we know the data pulls have run from Supermetrics.
I’m not going to pretend to know exactly how this works, but it does, and it’s awesome! Our developer did a great job creating this so we can offer it to more clients.
Example of Google Apps Script
If you are managing advertising campaigns on Twitter, LinkedIn, Facebook or Bing and want to have the ability for deep-dive analysis on performance in one reporting interface, then contact us and we can scope this out for you. Also learn more about how we can manage all your paid search advertising.

Leave a Reply